- Accumulation is taking place in EUR/GBP below the bearish 50 EMA channel.
- EUR/GBP bulls seeking a test of the M-formation’s neckline.
The following is an analysis of EUR/GBP that illustrates a bullish hypothetical scenario based on price behaviour, chart patterns and market structure.
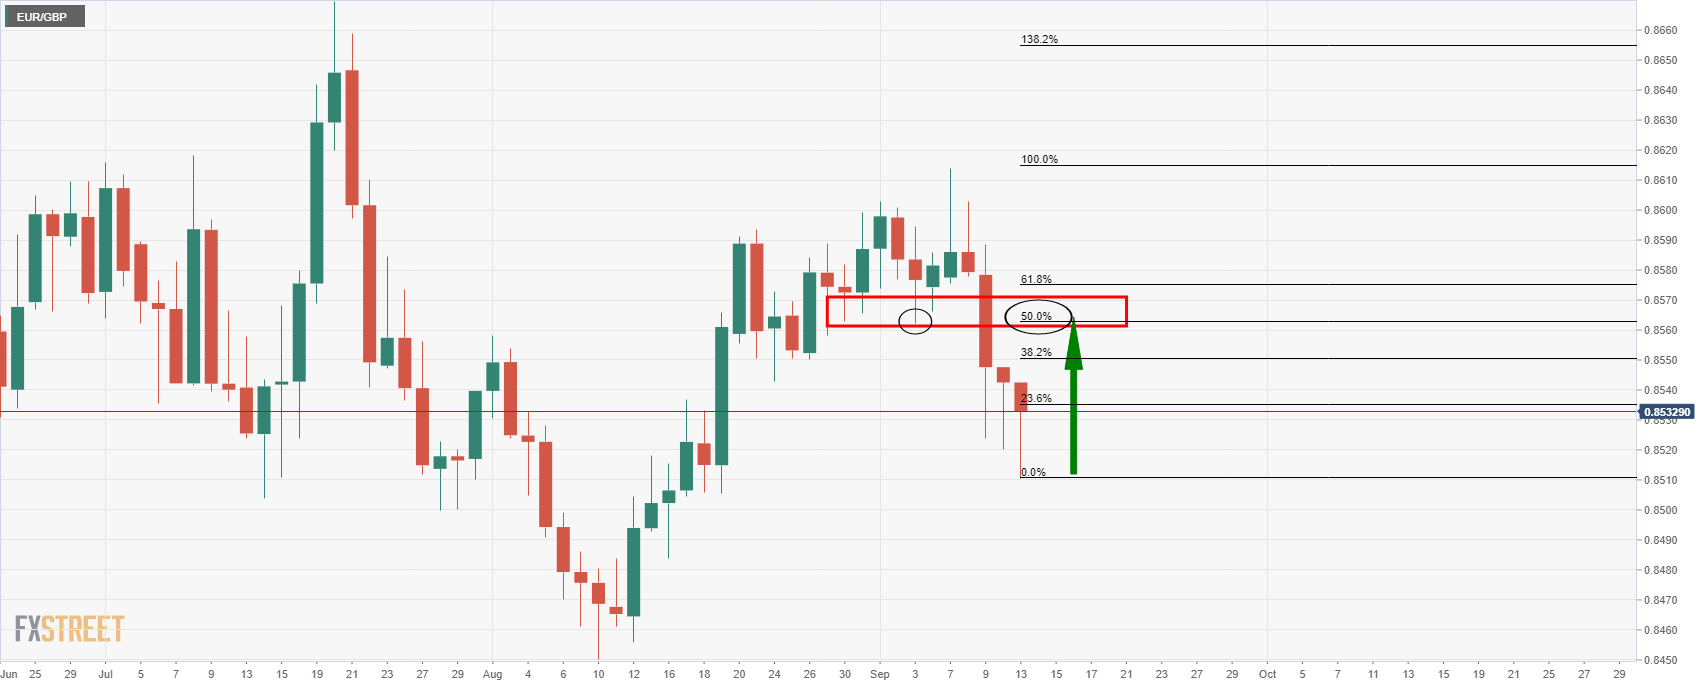
EUR/GBP daily chart
The M-formation is a bullish reversion chart pattern and has a high completion rate. The price would be expected to revert back to test the neckline of the pattern. In this case, where it meets the 50% mean reversion point near 0.8565.
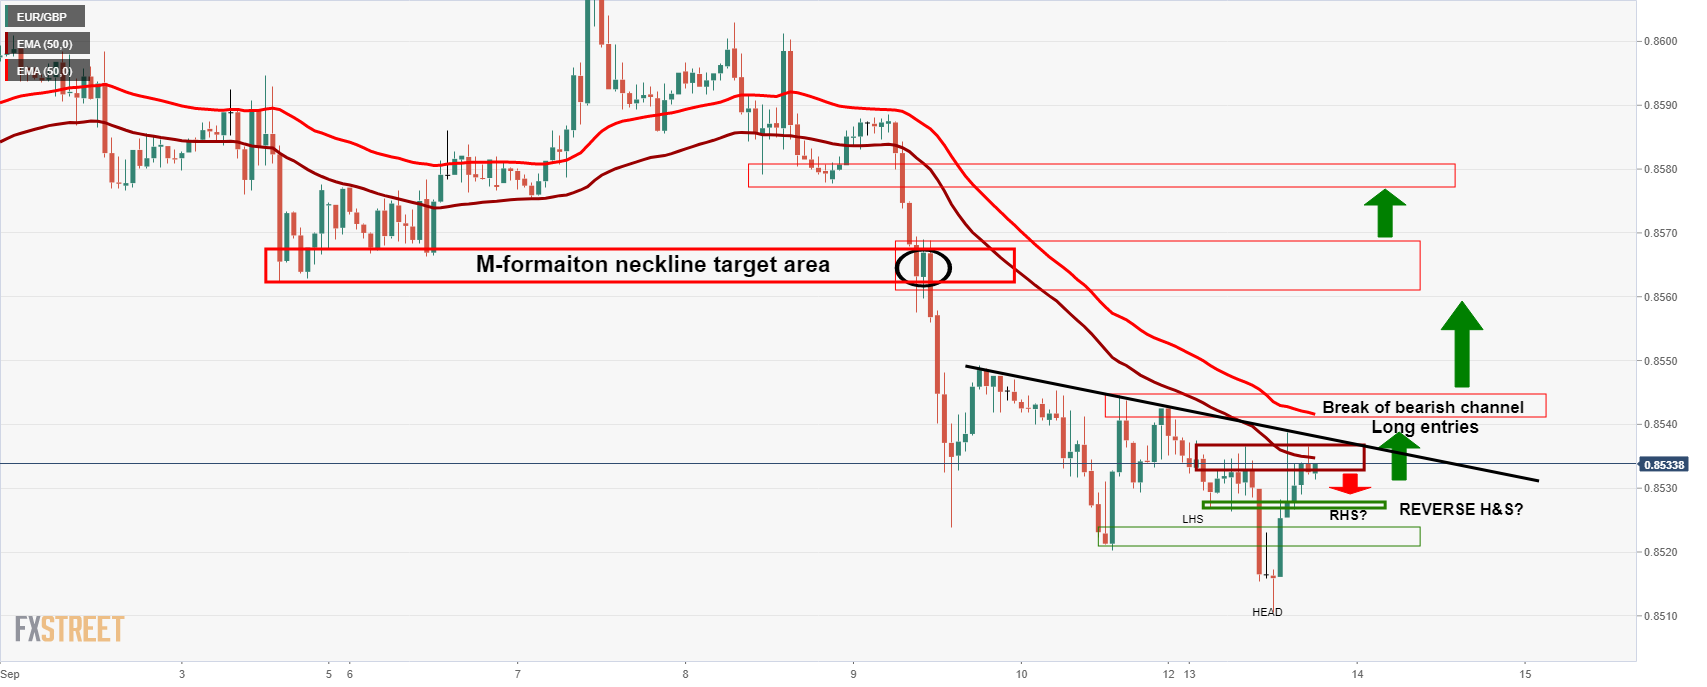
EUR/GBP hourly chart
Traders can look for an entry to target the neckline from a lower time frame, such as the hourly chart. On the hourly chart, traders can monitor for bullish structure. Hypothetically, the above illustrates a bullish scenario.
At the moment, the price is buried deep below resistance, but the reverse head and shoulders pattern, a bullish formation, could be in the making. The price will need to be supported above 0.8520, resulting in a right-hand shoulder of the hand and shoulders pattern, as illustrated above. In doing so, bulls will monitor for a break of the neckline and the dynamic trendline line resistance.
As the price moves beyond the trendline resistance, the 50 EMA channel will move from bearish to neutral and then bullish as the price continues its northerly trajectory. This could equate to further demand from buyers and help the price along the way to the target and beyond for the coming days.


