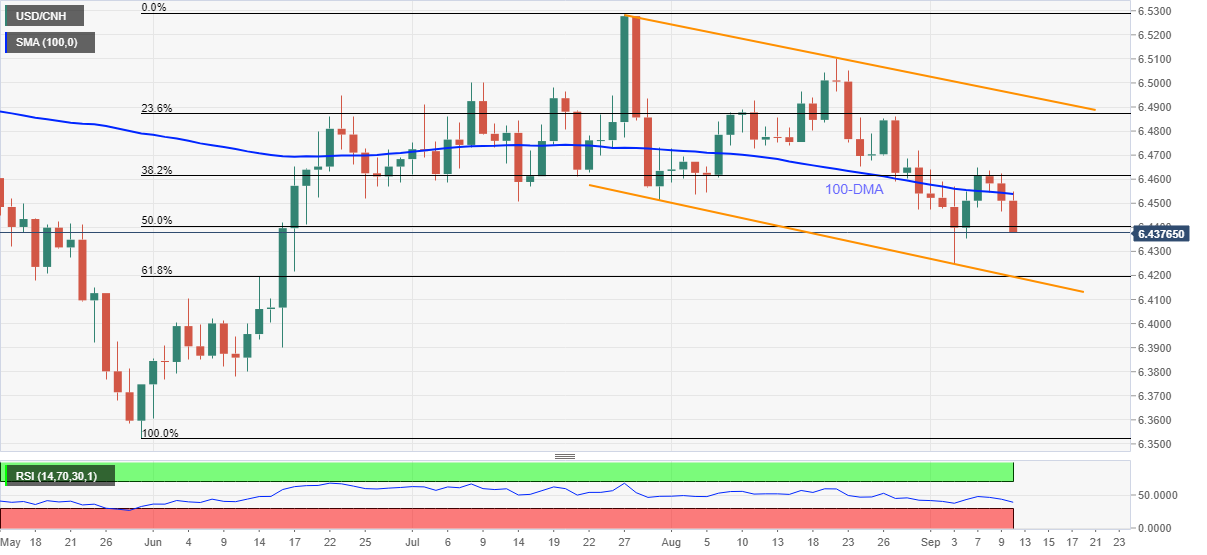
- USD/CNH prints three-day downtrend, bears attack weekly bottom.
- Descending RSI line, not oversold, joins SMA breakdown to back the sellers.
- Convergence of six-week-old support line, 61.8% Fibonacci retracement becomes a tough nut to crack for bears.
USD/CNH takes offers around 6.4400, down 0.17% intraday during the three-day fall ahead of Friday’s European session. In doing so, the offshore Chinese currency (CNH) pair stretches the latest failures to stay past 100-DMA.
Given the descending RSI line joining the weaker prices despite being not oversold, USD/CNH is likely to remain pressured towards the monthly low, also the lowest since June 17, around 6.4245.
However, a clear downside break of 50% Fibonacci retracement of the May-July upside, close to 6.4400, becomes necessary to strengthen the bearish impulse.
Should the quote remains weak past 6.4245, a confluence of a six-week-old falling trend line and 61.8% Fibonacci retracement near 6.4200 will be the key to watch.
Meanwhile, recovery moves need to cross the 100-DMA level of 6.4540 to recall the short-term buyers and direct them to the monthly peak of 6.4650.
Following that, 23.6% Fibonacci retracement level and a multi-day-old falling trend line, respectively around 6.4870 and 6.4955, will be the key figures to watch before confirming any further upside.
USD/CNH: Daily chart
Trend: Further weakness expected

