This chart is a gem
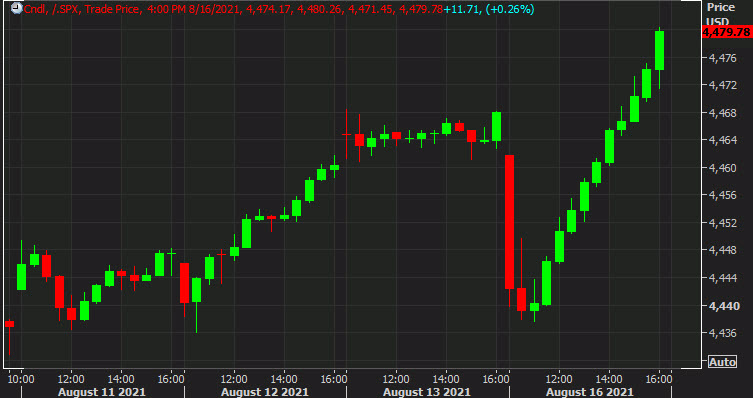
Here’s the 30 minute chart of the cash S&P 500 index. You can see the big drop at the open today, some choppy trading for the next hour and then utterly relentless buying.
It’s the kind of pattern we’ve seen play out so many times, though not always as picturesque as today’s chart.
The message for me is that the bulls are completely undaunted. Nothing matters so long as rates are ultra-low, the Fed is feasting on bonds and the fiscal taps are open.
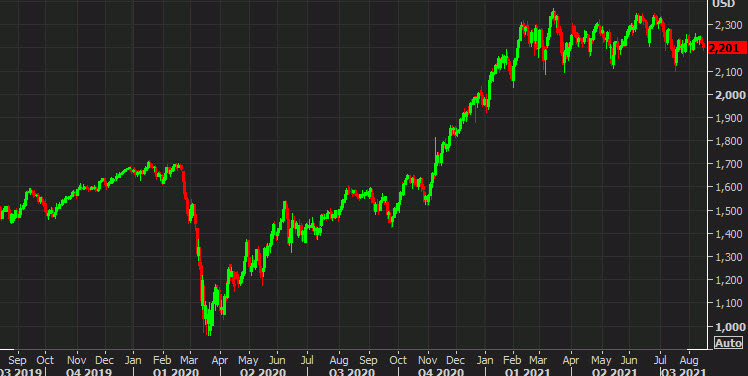
One chart that’s more-concerning is the Russell 2000. It’s been moving sideways since January and is more-similar to the yen crosses and EM currencies, highlighting the uncertainty in markets.

This article was originally published by Forexlive.com. Read the original article here.
