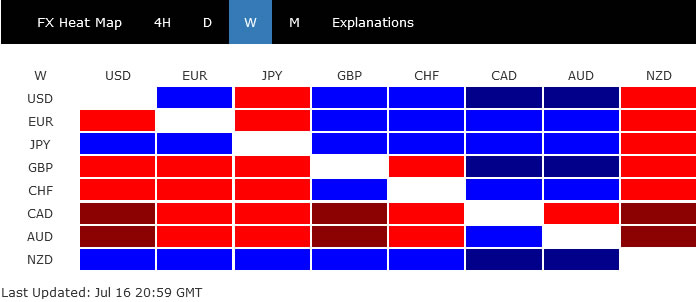
New Zealand Dollar ended as the strongest one last week, boosted by hawkish expectation on RBNZ. Though, the Kiwi’s strength didn’t provide much support to other commodity currencies, as Aussie and Loonie were indeed the worst performing ones. Yen and Dollar followed Kiwi as the next strongest, while European majors were mixed, with Sterling at a lower hand.
We’d like to argue that firstly, Kiwi’s overall strength was not confirmed yet, as both NZD/USD and NZD/JPY were just range bound. Resilience in Dollar and Yen were helped by indecisiveness in risk sentiments. In particular, Dollar’s momentum was actually not too convincing. Yet, developments in stocks and yield could to give Dollar another rising leg before it heads south again.
Kiwi surged on RBNZ, but broad based strength not secured yet
New Zealand Dollar’s strong rally was fueled firstly by RBNZ’s surprised halt of its asset purchase program, starting July 23. Then, much stronger than expected Q2 CPI reading, which blown away RBNZ’s own forecasts, triggered talks the central bank could raise interest rates as soon as in August, as many as three times this year.
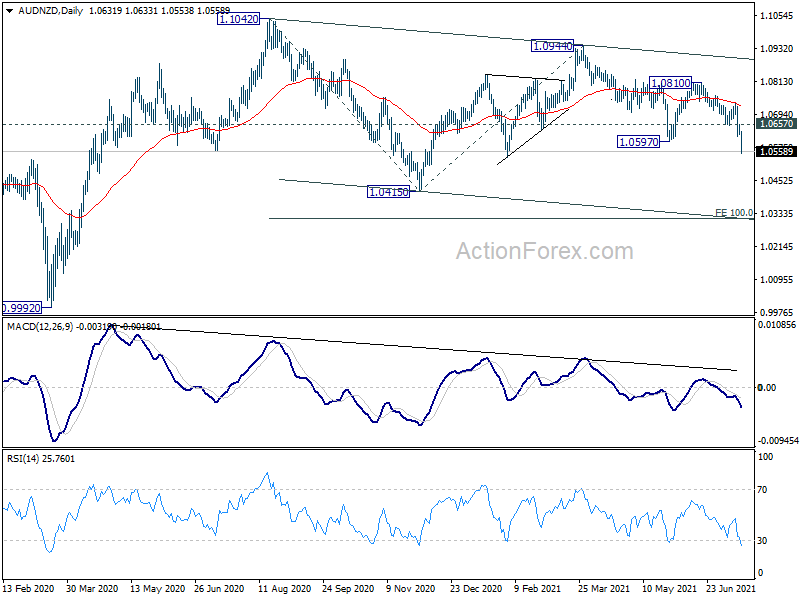
Kiwi’s strength was most apparent against Aussie, as RBA maintained that conditions for rate hike won’t be met as least until 2024. AUD/NZD took out 1.0597 support to resume the fall from 1.0944, hitting as low as 1.0553. Current downside acceleration argues that it might be resuming the fall from 1.1042. Deeper decline is expected as long as 1.0657 resistance holds. AUD/NZD could drop through 1.0415 support to 100% projection of 1.1042 to 1.0415 from 1.0944 at 1.0317.
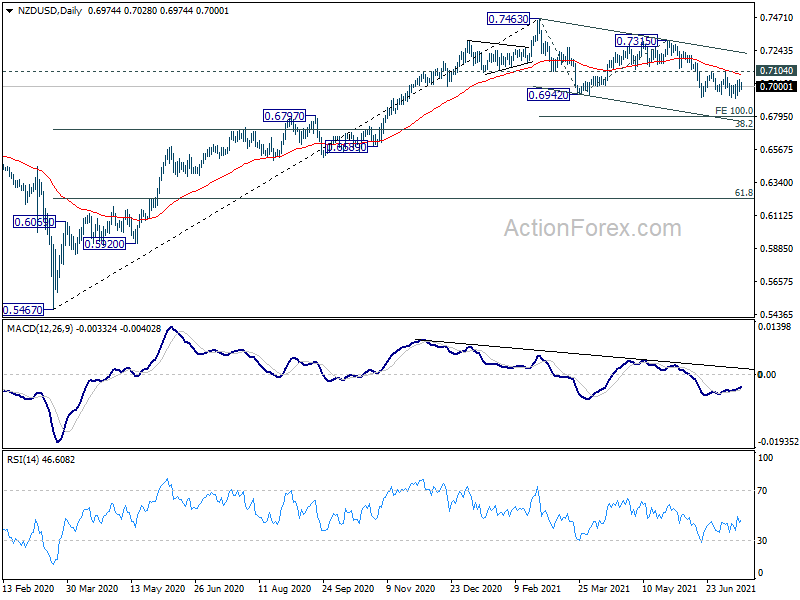
However, against Dollar and Yen, Kiwi was indeed not that strong. NZD/USD was still bounded in established range, held below falling 55 day EMA. It’s likely still in the decline from 0.7463, which could extend to 100% projection of 0.7463 to 0.6942 from 0.7315 at 0.6794 before completion.
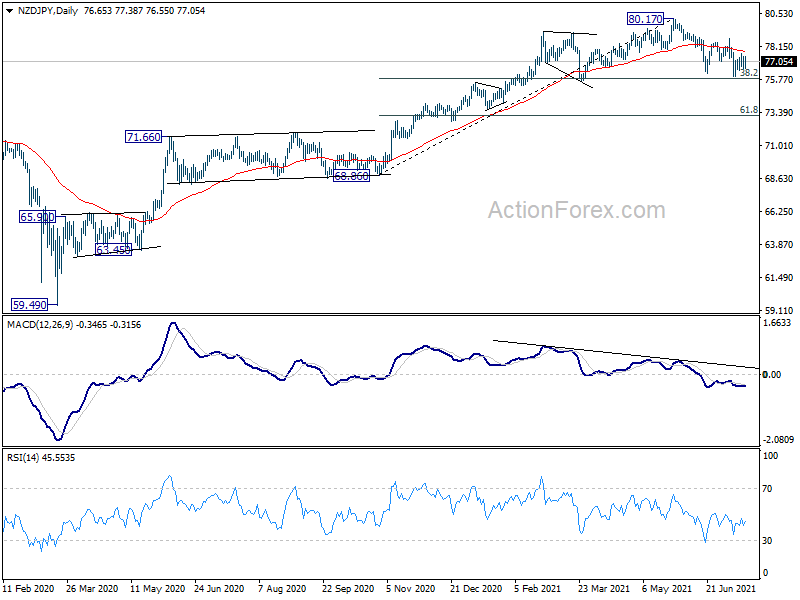
Similarly, NZD/JPY was also held in range, kept below 55 day EMA. We’re expecting strong support from 38.2% retracement of 68.86 to 80.17 at 75.84 to contain downside as finish the corrective pattern from 80.17. However, sustained break of 75.84 could bring even deeper correction to whole up trend from 59.49. Overall, New Zealand Dollar’s broad based strength is not secured yet.
DOW struggled to break through key resistance
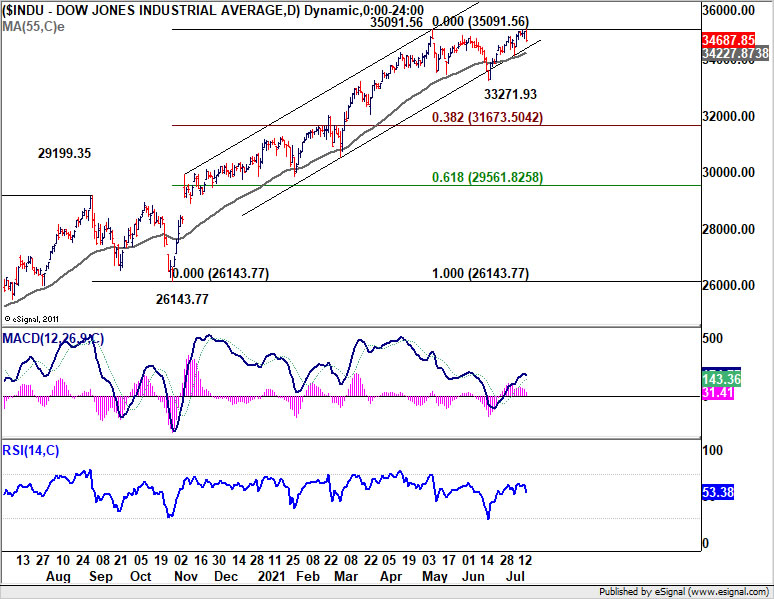
The resilience of Dollar and Yen was somewhat provided by DOW’s failure to break through 35091.56 resistance decisively. There is still risk that consolidation from would extend with another falling leg, and break of 55 day EMA (now at 34227.87) would bring deeper fall from 33271.93 support and possibly below. Yet, as long as the 55 day EMA holds, further rise should be seen sooner rather than later, to catch up with record runs in S&P 500 and NASDAQ.
10-year yield back at 1.3 as rebound faltered
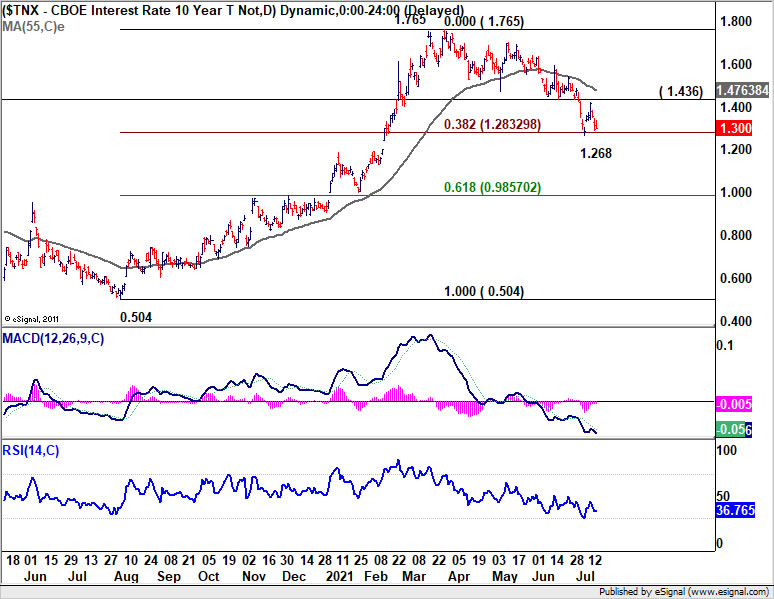
TNX closed the week in a rather weak way at 1.300 after brief rally. At this point, we’re still seeing no strong reason for a powerful push through 1.268 support. However, the rejection by 1.436 support turn resistance, and the stay below 55 day EMA is kind of bearish. Firm break of 1.268 could extend the correction from 1.765 back towards 1.000 handle, which is close to 61.8% retracement of 0.504 to 1.765 at 0.985. Such development, if happens, could come in tandem with deeper fall in DOW mentioned above.
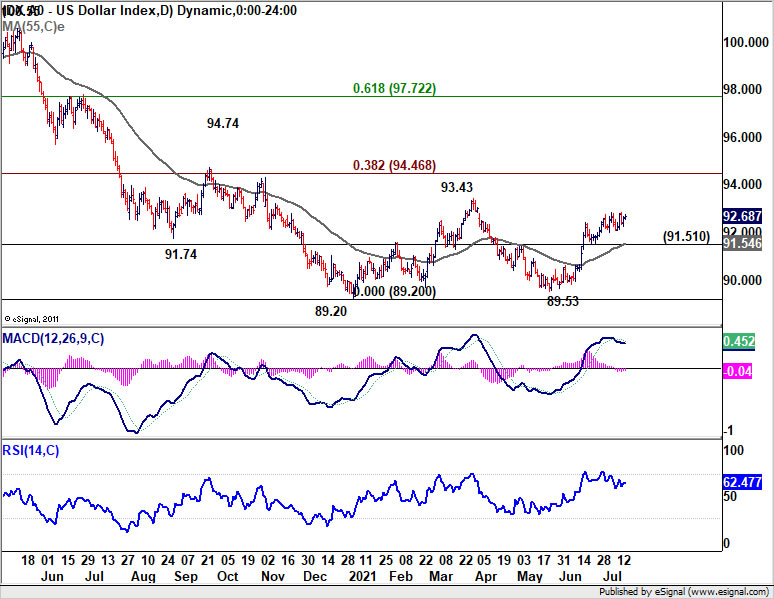
Dollar index continued to lose momentum
Dollar index continued to lose upside momentum last week, as seen in daily MACD. We’d stay cautious on topping around current level to complete the third leg of the corrective pattern from 89.20. Break of 91.51 support, as well as 55 day EMA (now at 91.54), will bring deeper fall back to retest 89.20 low. However, fall in yield and stocks together could push DXY for another rise to 93.43 resistance before completing the corrective pattern.
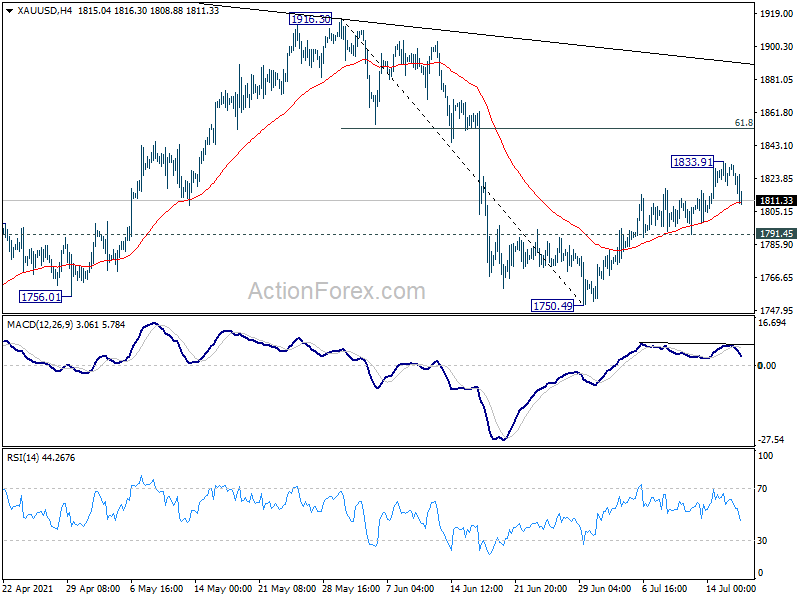
Gold extended rebound, but lacked follow through
As usual, we’d monitor the developments in Gold to double confirm the outlook in Dollar. Rebound from 1750.49 extended to as high as 1833.91 last week but lost momentum since then. For now, further rise is still in favor as long as 1791.49 support holds. Rebound from 1750.49 would resume later to 61.8% retracement of 1916.30 to 1750.49 at 1852.96. However, firm break of 1791.45 support will argue that the rebound might be completed and turn bias to the downside for this support. That, if happens, could be an early indication of extending rebound in DXY mentioned above.
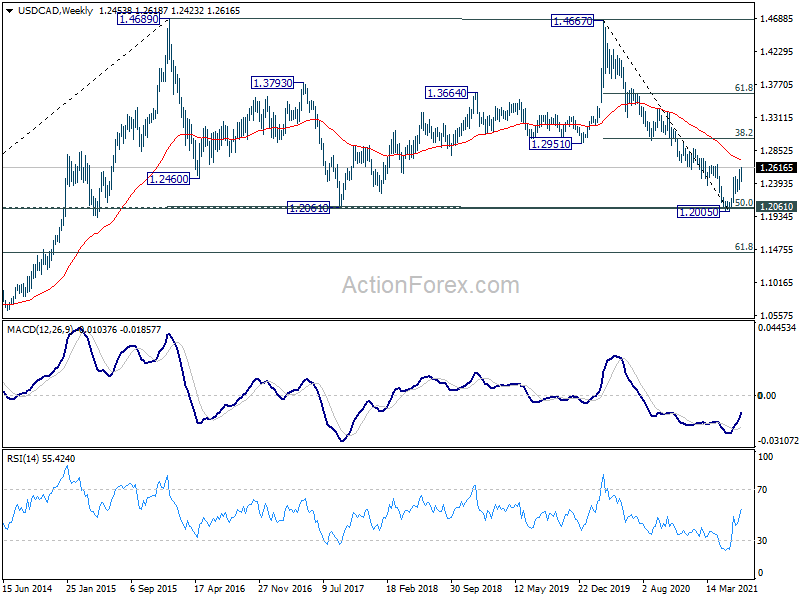
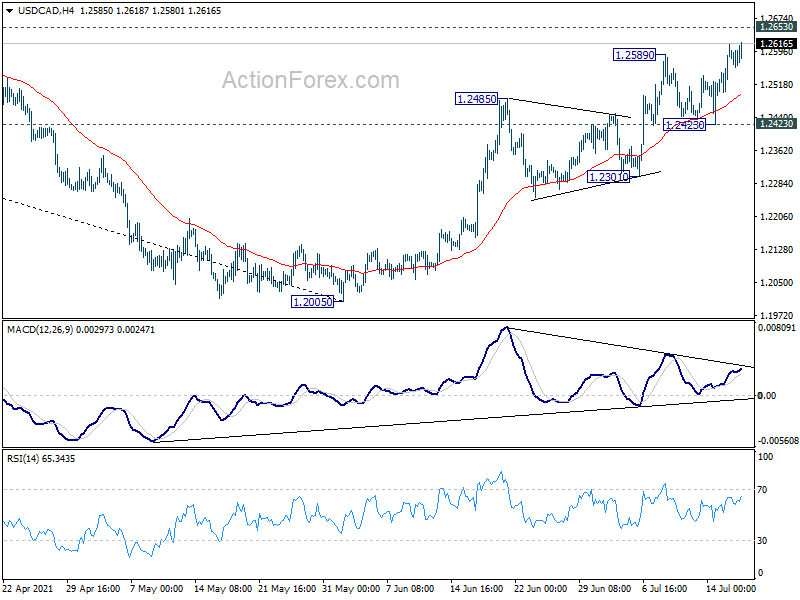
USD/CAD’s rise from 1.2005 resumed last week and closed strongly at 1.2616. Initial bias stays on the upside this week for 1.2653 structure resistance. Sustained break there will confirm near term reversal. Stronger rise would then be seen to 1.3022 medium term fibonacci level next. On the downside, break of 1.2423 support is needed to indicate short term topping. Otherwise, outlook will remain bullish in case of retreat.
In the bigger picture, fall from 1.4667 is seen as the third leg of the corrective pattern from 1.4689 (2016 high). It might have completed after hitting 1.2061 (2017 low) and 50% retracement of 0.9406 to 1.4689 at 1.2048. Sustained break of 38.2% retracement of 1.4667 to 1.2005 at 1.3022 will pave the way to 61.8% retracement at 1.3650. Overall, medium term outlook remains neutral at worst with 1.2048/61 support zone intact.
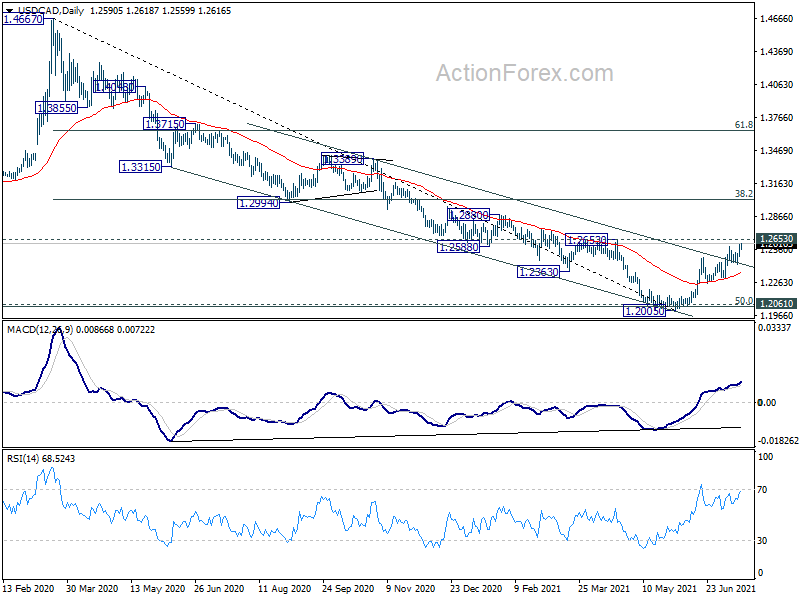
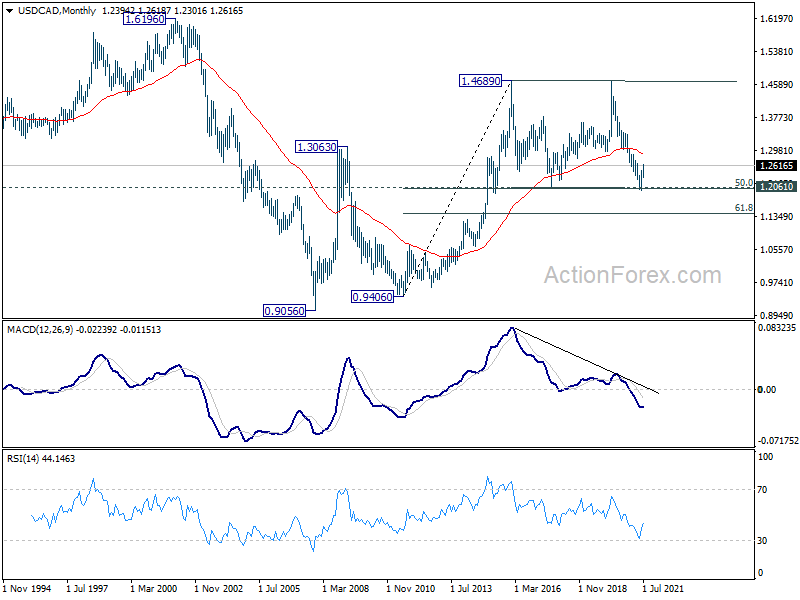
In the longer term picture, we’re viewing price actions from 1.4689 as a consolidation pattern. Thus, up trend from 0.9506 (2007 low) is still expected to resume at a later stage. This will remain the favored case as long as 1.2061 support holds, which is close to 50% retracement of 0.9406 to 1.4689 at 1.2048. However, sustained break of 1.2061 will be a sign of long term bearishness. Deeper fall would be seen to 61.8% retracement at 1.1424 and below.