What break levels are in play?
What levels will be in play for some of the major currency pairs through the FOMC decision?
As a reminder there is no central tendencies or dot plots. Only the statement and the press conference which will take place at 2:30 PM ET and typically lasts an hour.
Understand, that there is not a lot of expectations for any change in policy or taper guidance. Nevertheless, that does not mean that there will not necessarily have some breakouts and runs. Of course more surprises – like a timetable for tapering – could lead to some trend like moves.
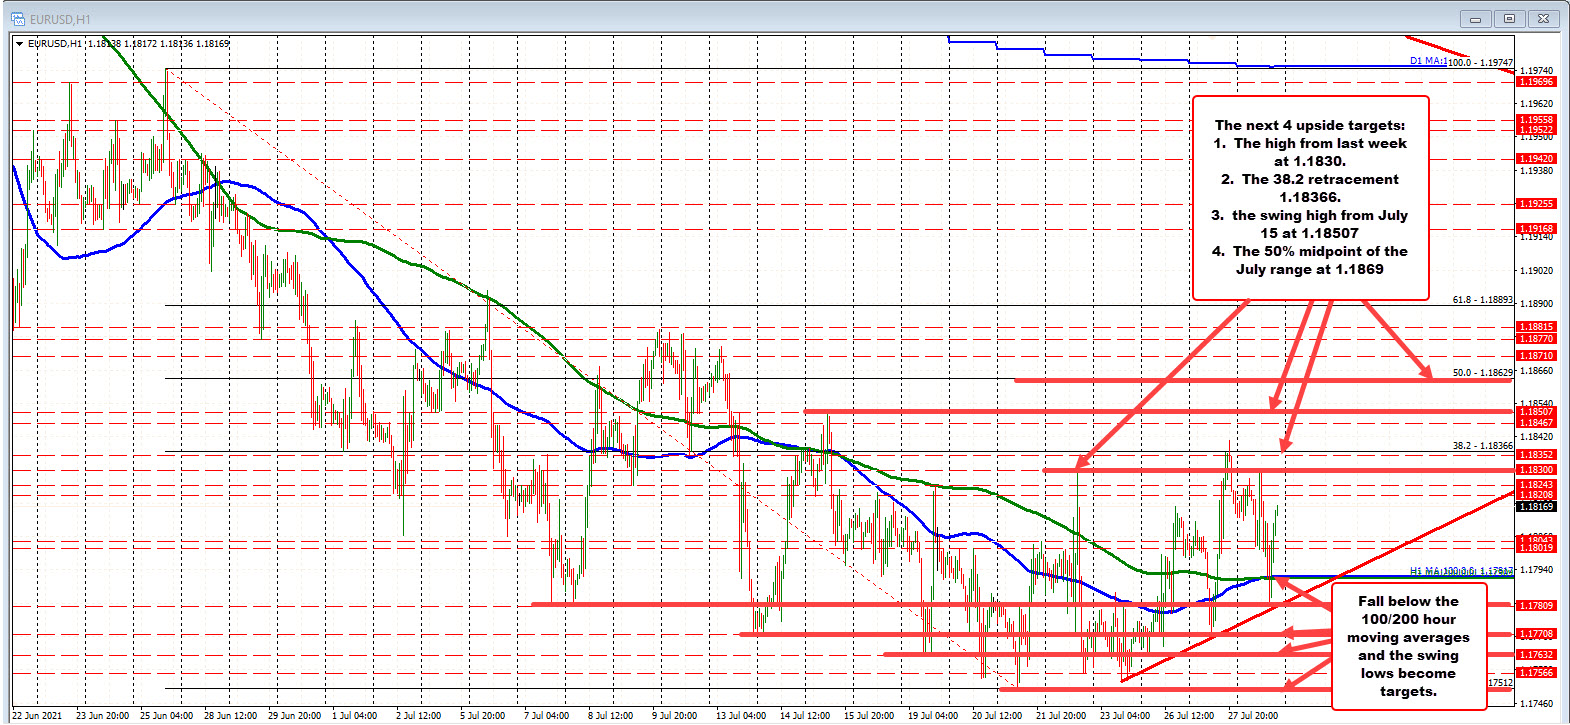
EURUSD: Current price is at 1.1815. The 100 and 200 hour moving averages are converged at the 1.1790 level - 25 pips from the current level – . The price earlier today tried to break below that level in the NY session but snapped back within an hour. A break below will be a bearish tilt. Stay below, and we should see a run toward the lows seen over the last few weeks including 1.1770, 1.17632, 1.17566 and the low for July at 1.17512. Break below the low of July and traders will start to think about the low for 2021 at 1.17041.
On the topside (dollar selling) the swing high from last week came in at 1.1830. The 30.2% retracement of the July range comes in at 1.18366. Yesterday, the price squeezed above both those levels but only for a few minutes before moving back down. If the buyers are to take more control, getting above the 38.2% retracement is a minimum retracement target to get to and through. That will be a barometer for a more bullish bias. Above that, the 1.18507, and the 50% midpoint of the month trading range comes in at 1.18629. Getting above the 50% midpoint is another hurdle that needs to be broken and stay broken if buyers are to remain in control. Get above that level and the door opens up for further upside momentum.
GBPUSD: Current price is at 1.3884. The GBPUSD is going into the rate decision near the highs for the month of July. Swing highs come in at 1.38979, 1.39045 and 1.39094. There is one other key level close by at 1.39203. That is home to the 100 day moving average. With the current price at 1.3884, it is not that far away from those levels. Get above the 100 day moving average would be the first break since June 24. Stay above keeps the buyers more control with the 1.4000 to 1.40167 area as the next major target. That area is home to a swing highs from the month of March and April and swing lows from the month of May. In June, the price move below that swing area and has stay below since that time.
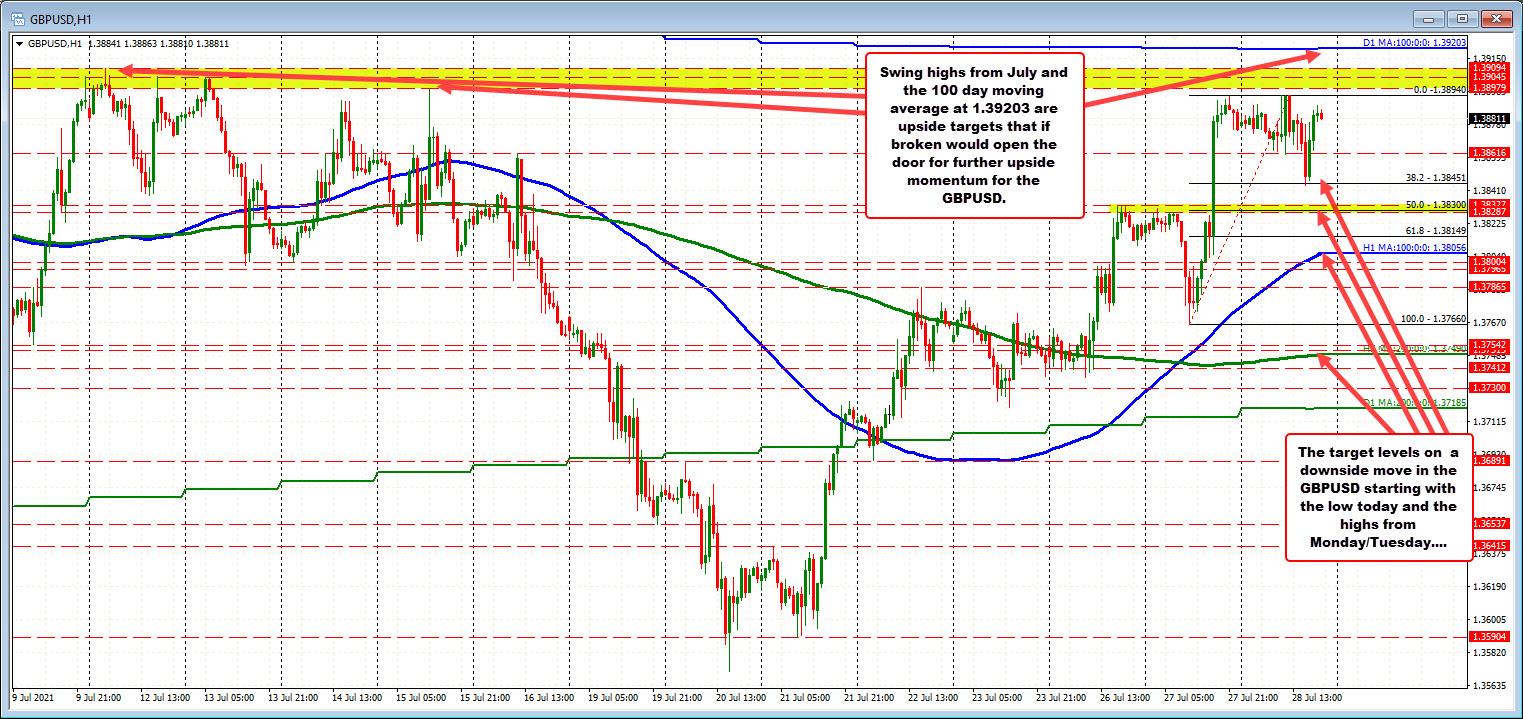
On the downside, the low today stalled at the 38.2% retracement of the move up from yesterday’s low at 1.3845. Get below that level and swing highs from Monday and Tuesday near 1.3830 would be the next target, followed by the rising 100 hour moving average at 1.38056. A move back below the 100 hour moving average would tilt the bias more to the downside and have traders looking toward the low from yesterday at 1.3766 followed by the 200 hour moving average at 1.3748
USDJPY: Current price is at 110.05. The USDJPY as the 100 hour moving average at 110.175 and the 200 hour moving average at 110.04. The current price is just above the 200 hour moving average. Those moving averages will be the barometer for the buyers and sellers. Move above the 100 hour moving average is more bullish. Move below the 200 hour moving average and the bias is more bearish.
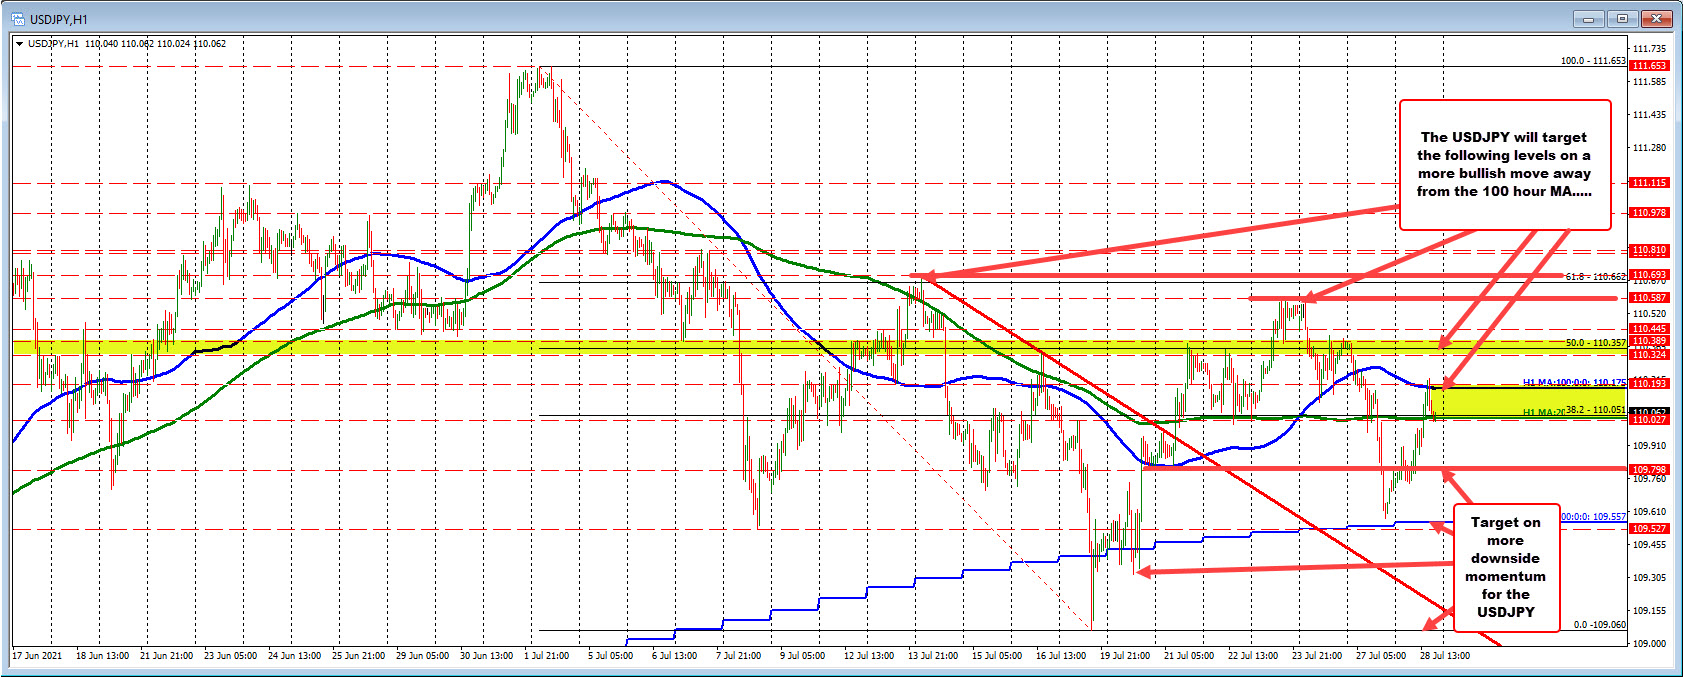
On the downside, the 109.80 level is my first target (was a swing low from July 21). Below that and traders will target the 100 day moving average of 109.557. That moving average is near the low from yesterday’s trade as well. Break below the 100 day moving average, and there should be more downside momentum. The swing lows from July 19 at 109.32 and the low for July from July 19 at 109.06 would be targeted next.
On the topside, the 50% retracement of the July range comes in at 110.357. There are swing levels between 110.32 and 110.39 that brackets that midpoint level. Get above that level, and the door opens up for a run toward the highs from Monday/Tuesday near 110.58, followed by the swing high from July 13 at 110.693.