The pair finishes higher on the week
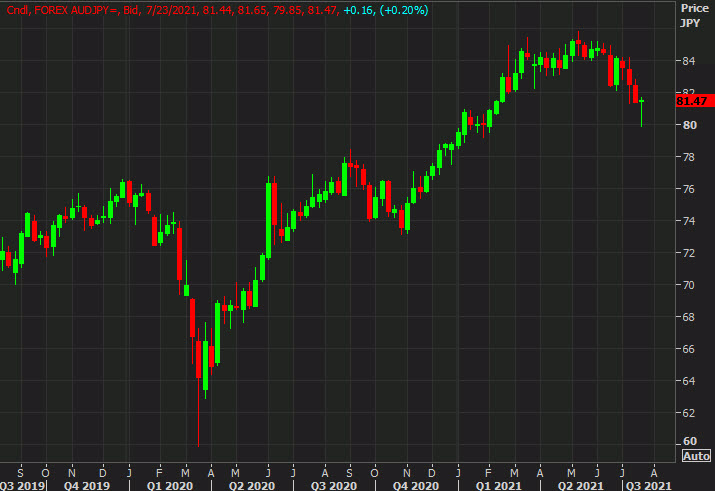
I love a dragon fly doji like the one on the AUD/JPY chart this week.
It’s a classic sign of uncertainty and a potentially violent reversal. The week started with lockdowns in Australia and broad risk aversion but it’s ending with the S&P 500 at all time highs.
The low ticked just below 80.00 and it’s now poised for another big week. I don’t entirely rule out another trip lower but it would take some surprisingly bad covid news or a Fed blunder.
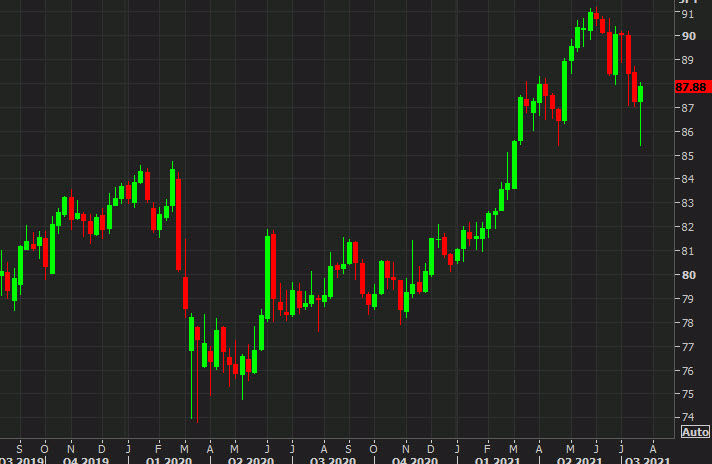
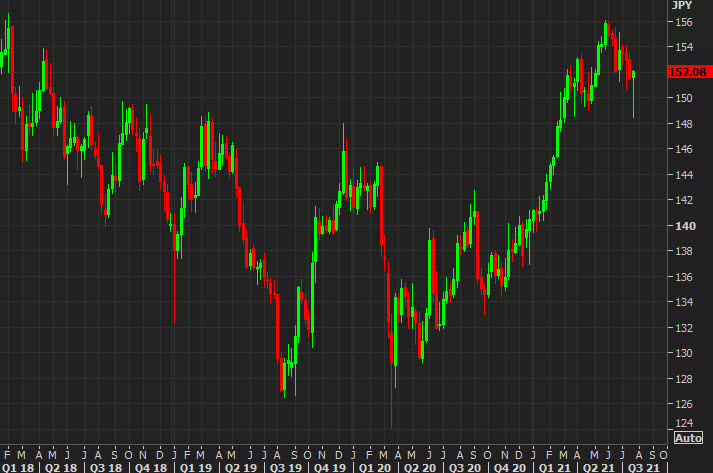
What’s notable is that all the yen cross weekly charts are similarly intriguing.
CAD/JPY is trying to trace out a double bottom at the April low:
GBP/JPY is similar but also ticked off a series of old highs from 2018 through 2020 — a suggestion that it’s comfortable in a higher range.
This article was originally published by Forexlive.com. Read the original article here.