Retraced the entire August move to the downside now
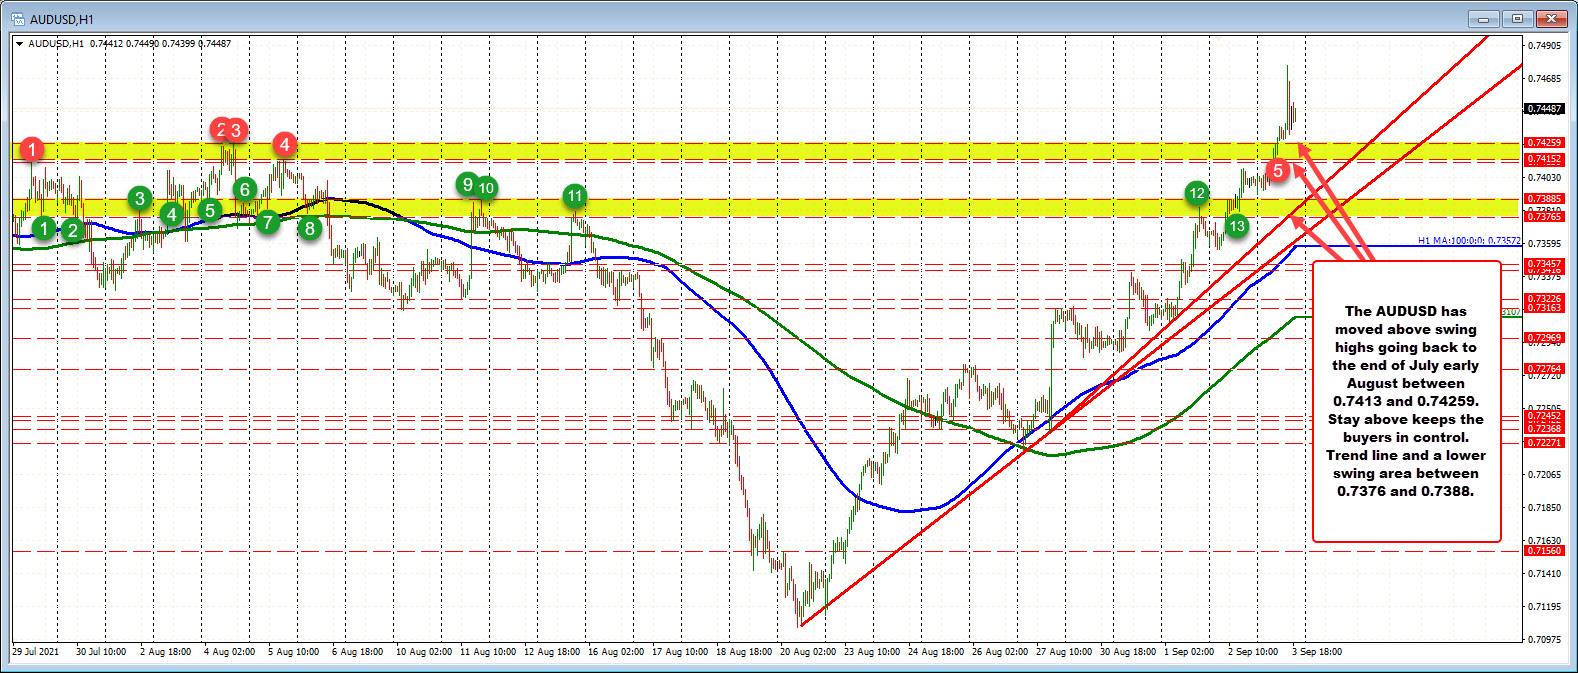
The AUDUSD has risen 48 Alaska trading days. Over that time period, the move down in the month of August from 0.74259 to 0.71059 has been completely retraced (and then some).
The price action today has taken the price above the August 5 high at 0.74259. Once broken, the price has remained above that level as well. If the price can stay above, the bulls stay in control.
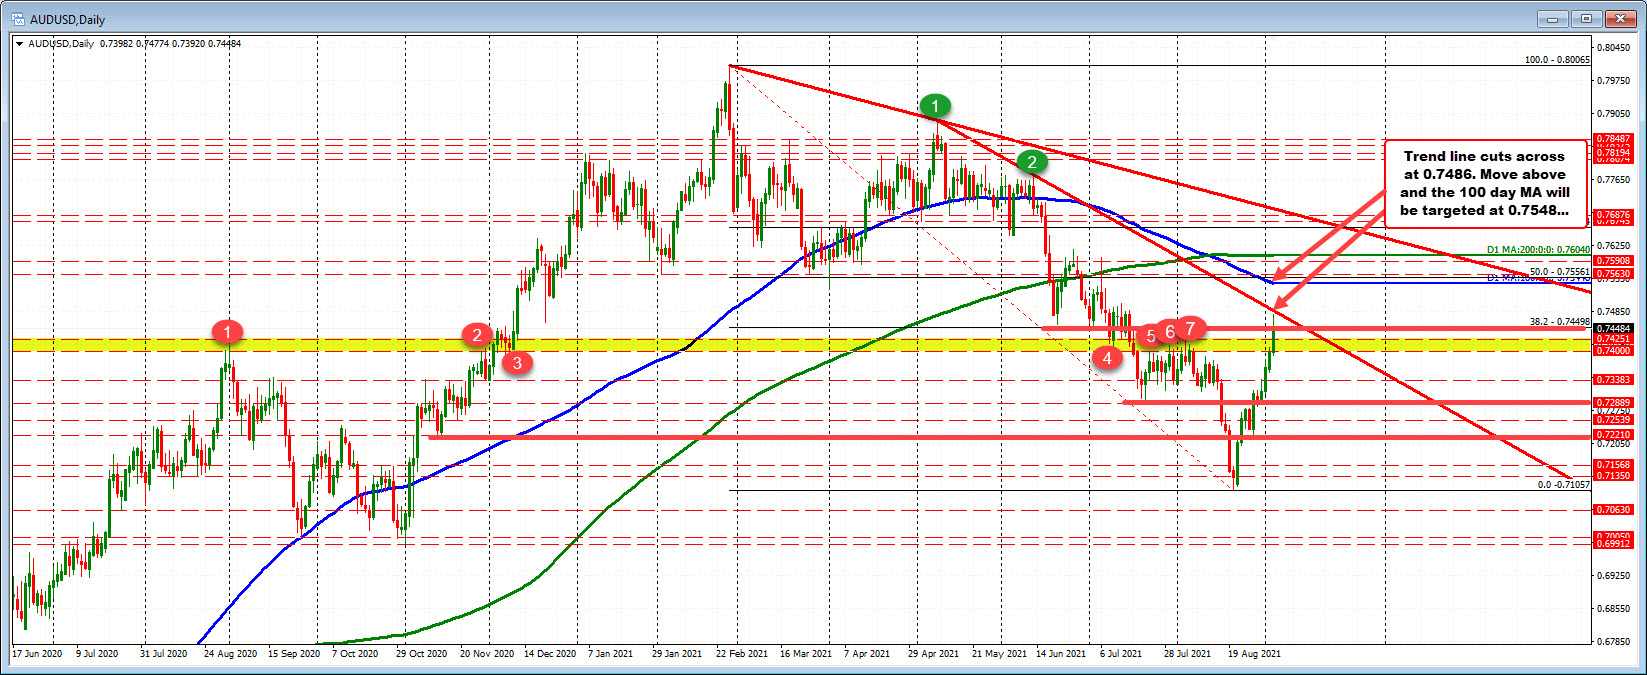
Taking a broader look at the daily chart, although the price has retraced the August decline, the pair remains well off the high for the year at 0.8006 reach back on February 25. Today however, the price did extend above the 38.2% retracement of the 2021 trading range at 0.74498. Currently the price trades just around that level.
On further upside momentum, a downward sloping trendline cuts across at 0.7486. Getting above that level is the next target if the buyers are to continue the run higher. Above that , the falling 100 day moving average at 0.7548 would be a another key target.

