The major indices are all in the black with the Dow leading the way to the upside. That index is leading the way with a gain of 1.30% or 422 points. The S&P is up 0.87%. The Nasdaq is lagging but still higher by 0.77%.
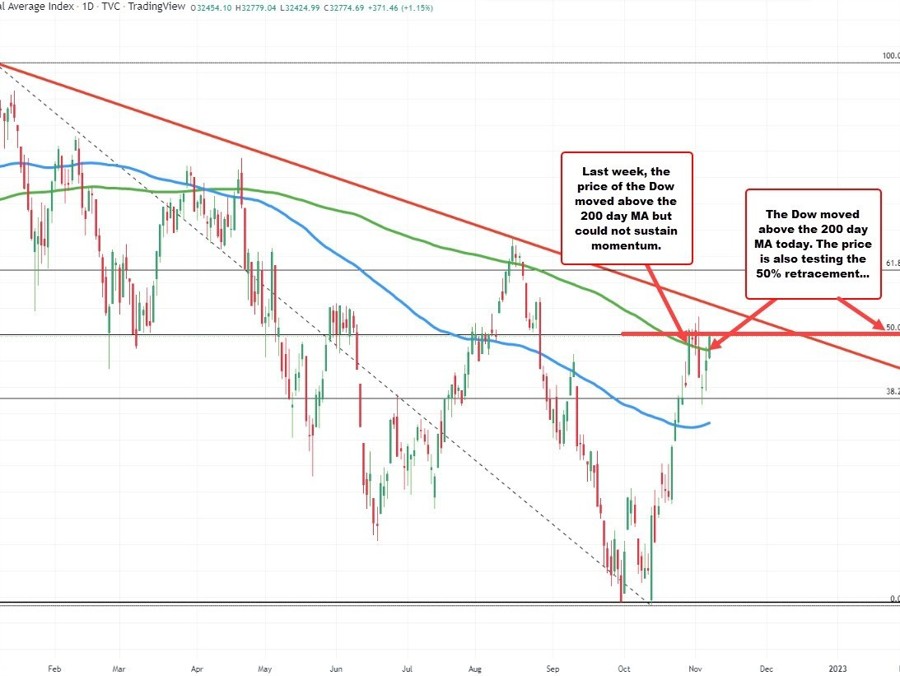
Dow above the 200 day MA and tests 50%
Looking at the Dow daily chart, the pair is back above its 200 day MA at 32560.20. The current price is at 32822. Last week, the price was above the 200 day MA, but could not keep the momentum going.
Also in play for the Dow index is the 50% of the move down from the January 2022 high. That level comes in at 32806.80. The price has moved above that level now on the last run higher.
Looking at the S&P index, it is higher but the price remains below the 38.2% but only of the move down from the August high. That level comes in at 3810.05. The high just reached 3804.30
Last week, the S&P price tested the 100 day MA currently at 3897.99 (call it 3900). The good news is the low last week stalled ahead of the broken trend line before bouncing higher.
S&P tests 38.2%
Meanwhile with stocks higher, the EURUSD is making new highs as is the GBPUSD.