UK FTSE 100 lower on the week
The European major indices are ending the day mostly higher. The snapshot of the provisional closes are showing:
- German DAX, +0.4%
- France’s CAC, +0.7%
- UK FTSE 100 , flat
- Spain’s Ibex, +0.8%
- Italy’s FTSE MIB, +1.0%
For the week, the UK FTSE 100 felt modestly. The other major indices were higher:
- German DAX, +0.14%
- France’s CAC, +0.1%
- UK FTSE 100, -0.3%
- Spain’s Ibex, +0.6%
- Italy’s FTSE MIB, +0.7%
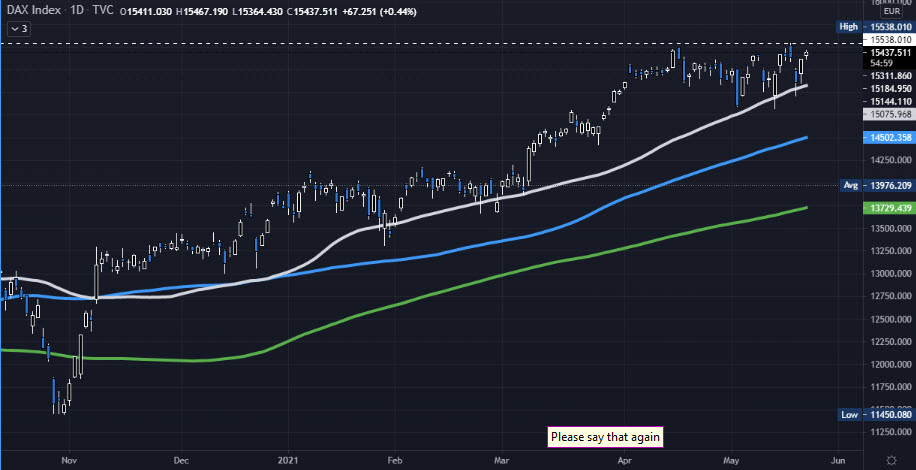
Looking at the daily chart of the German DAX, the index on Tuesday reached a new all-time intraday high of 15538.01 before rotating back to the downside. The move lower saw the price retest its 50 day moving average (white line in the chart below currently at 15075).
The price on Wednesday did dipped below that moving average level but recovered into the close. On Thursday, the low state above the level. Today the range was much more narrow with a higher bias.
In other markets as London/European traders look to exit.
- Spot gold is trading near unchanged at $1876.50 (down $0.70 or -0.04%).
- Spot silver, $-0.33 or -1.2% at $27.42
- WTI crude oil futures are recovering today and up two dollars or 3.26% at $63.96. The high for the day just reached $64.07
- Bitcoin is trading down $-2500 or -6.45% at $37,488
In the US stock market, the NASDAQ index has turned negative. The Dow industrial leads the way higher today.
- S&P +11.88 points or 0.29% at 4171.21
- NASDAQ index -21.08 points or -0.16% at 13514.30
- Dow industrial average up 250 points or 0.74% at 34333
