NASDAQ down -2.27%
the NASDAQ and S&P are trading to new session lows. The Dow industrial average remains positive but gives back most of the days gains:
- S&P index is down -26.57 points or -0.63% at 4205.61. That is just off the lows of 4204.17
- NASDAQ index -311 points or -2.26% at 13440. The low price is at 13433.53
- Dow is up 101 points or 0.29% at 34880. It’s low priice reached 34785.27
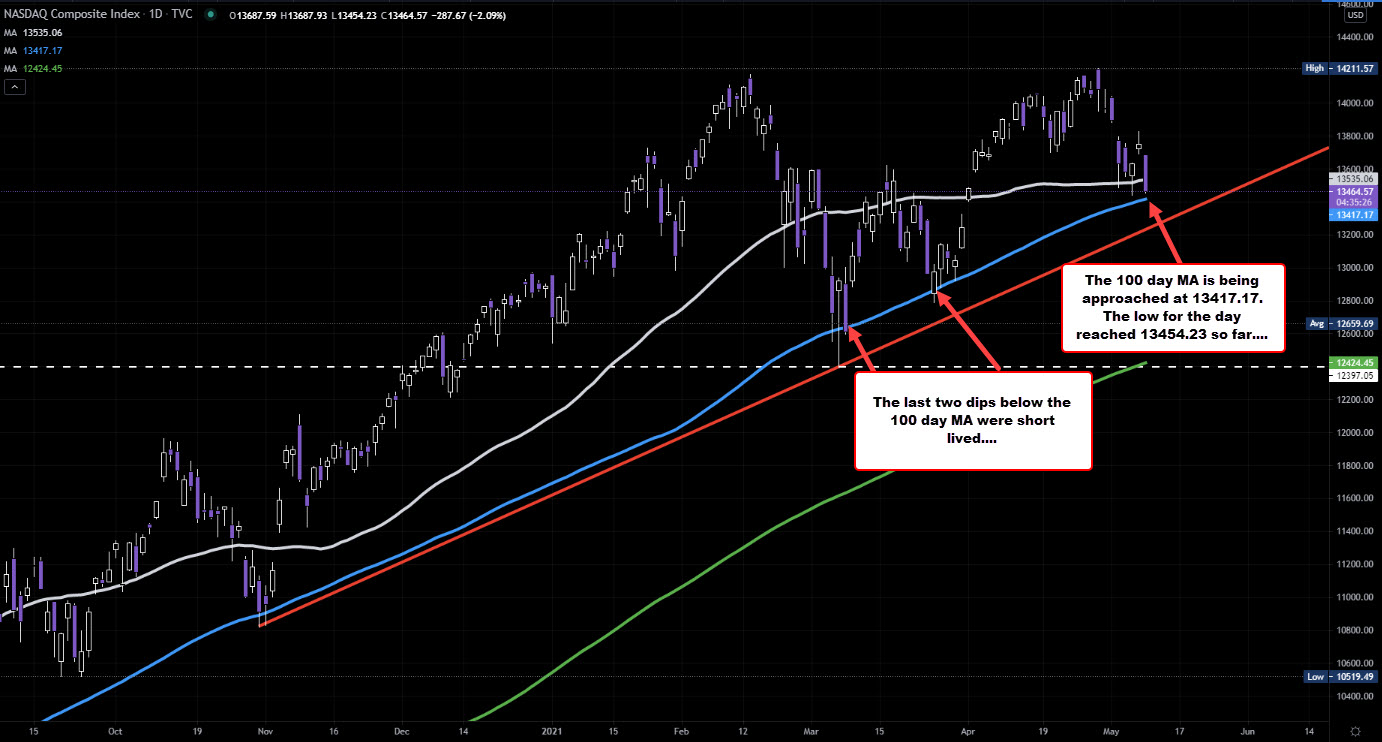
The Nasdaq is back below the 50 day MA at 13535.06 and looks toward its 100 day MA at 13417.17.
The index fell below its 100 day moving average for three consecutive days back in early March with one close below the moving average level before moving back to the upside.
Later in the month(on March 25) the price also traded below its 100 day moving average, but rebounded by the close and moved higher. You have to go back to April 2020 to have consecutive day closes below the 100 day MA.
This article was originally published by Forexlive.com. Read the original article here.