NZDUSD takes some of the oversold out of market. What next?
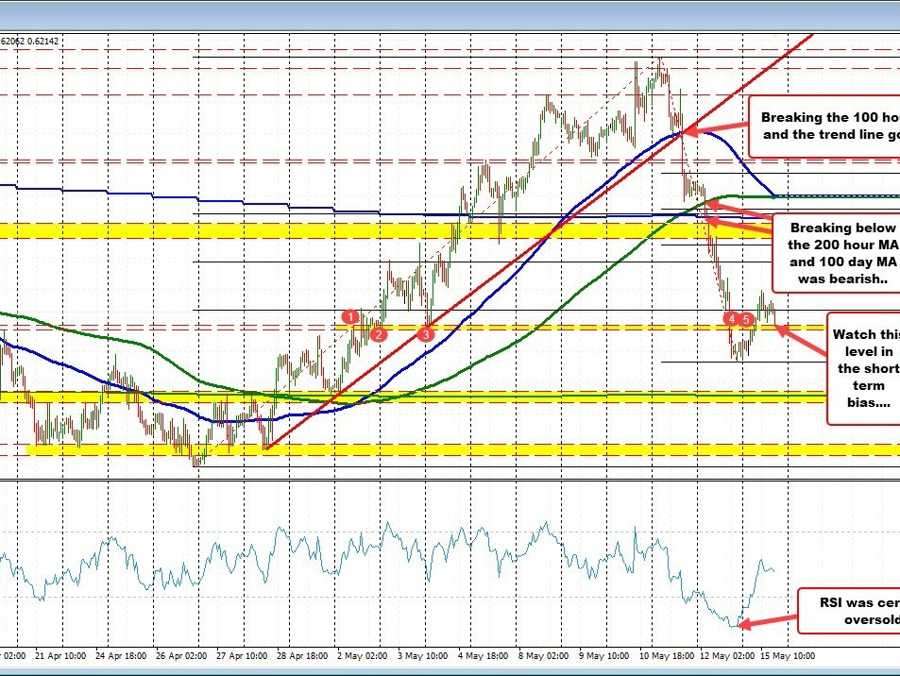
The NZDUSD experienced a sharp decline for two consecutive days (on Thursday and Friday last week), having reached its peak during last Thursday’s Asian trading session. The downward momentum was initiated technically by the pair’s dip below a rising trend line and the 100-hour moving average on Thursday. The downward trajectory was further cemented on Friday, with the pair breaking below both the rising 200-hour moving average and the 100-day moving average.
Friday’s trading session saw the pair’s lowest price at 0.6181. After a substantial drop of about 200 pips within a 40-hour span, the pair also fell below both the 50% and 61.8% retracement levels, indicating a heavily oversold state. While pinpointing a market bottom in a sharp downturn is challenging (markets can get more and more oversold), a rebound above the short-term swing area around 0.6202 – 0.6206 has helped alleviate some of the oversold pressure, and gave dip buyers something to believe in at least in the short term (see red numbered circles on the chart above).
However, the ensuing corrective move has remained relatively limited. Over the past 6-7 hours, the price has been gradually declining but is making an attempt to hold support against the 0.6202 – 0.6206 area. In the very short term, this area, extending down to 0.6200, is likely to serve as a critical support and bias-defining level. If the pair manages to stay above this level, we could see further rotation toward the upside. Conversely, a dip below this level could enable sellers to regain control and continue the downward momentum.
Looking ahead, the 0.6154 – 0.6162 area serves as a potential downside target, with the 200-day moving average nestled within this swing area at 0.61586.
