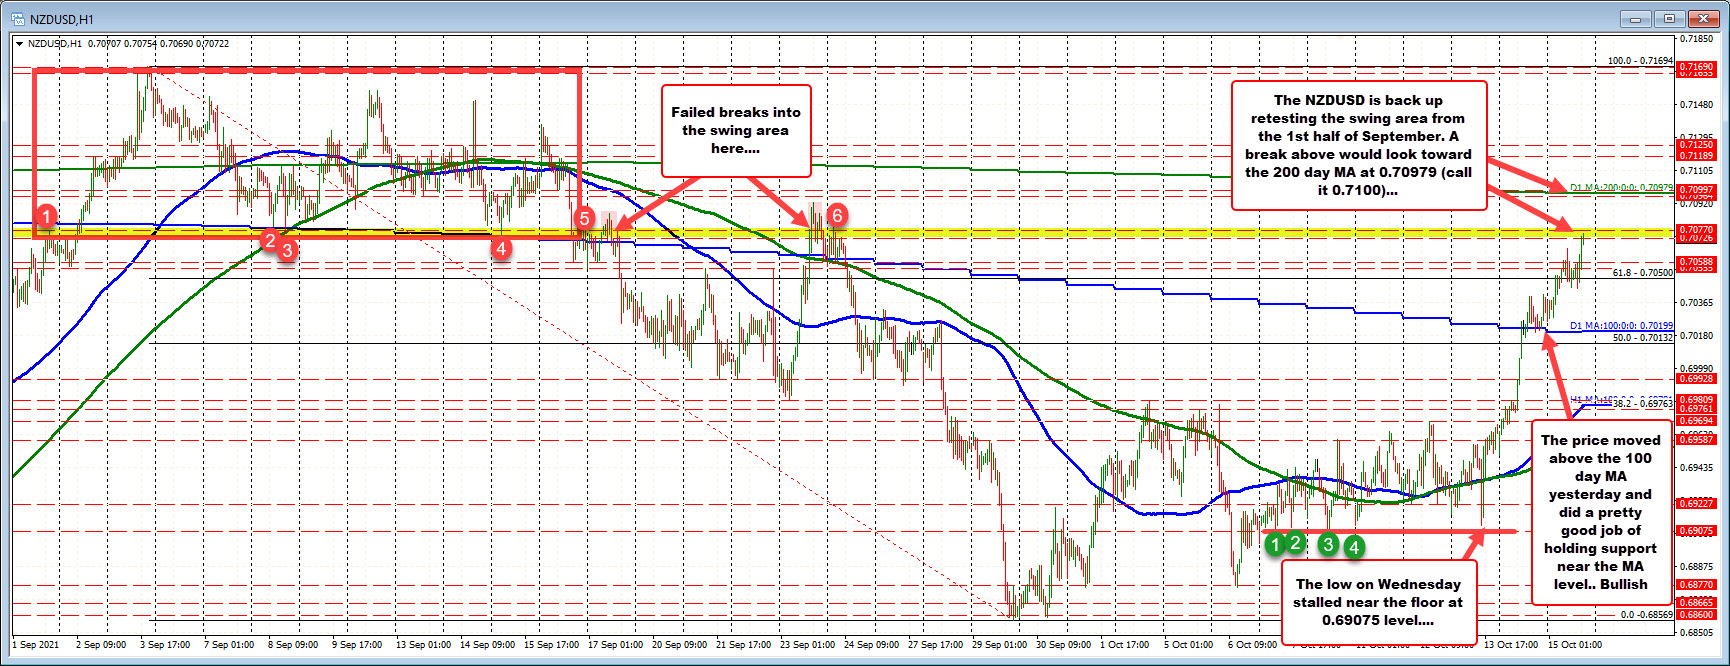
Swing area between 0.7072 and 0.7077
The NZDUSD has continued its run to the upside which started on Wednesday near the 0.6908 floor from October 7, October 8 and October 11. The low price on Wednesday reached 0.69106, and bounced higher.
Yesterday’s trading action saw the pair move above its 100 day moving average (currently at 0.70199 – see higher blue line in the chart above). Buyers did a good job of holding support against that level, and the price continued the run to the upside in trading today.
The pair just reached a new session high at 0.7775. That took the price into a swing area between 0.7072 and 0.7277. That swing area corresponds with the low of a consolidation range going back to early September to mid-September (between 0.7272 and 0.71694 - see red box in the chart above and the red numbered circles).
So far sellers are trying to lean against that swing area. A move above would have traders targeting the 200 day moving average at 0.70979 (call it 0.7100) and also moved the price more into the consolidation range from September.
If sellers enter against the swing area here, watch the 0.7056 level for close support. Move below that level – and then the broken 61.8% retracement at 0.7050 – would have traders thinking more about downside probing.
That could see the price move back down toward the broken 100 day moving average near 0.7020.