USDCAD trades above 100/200 hour MA
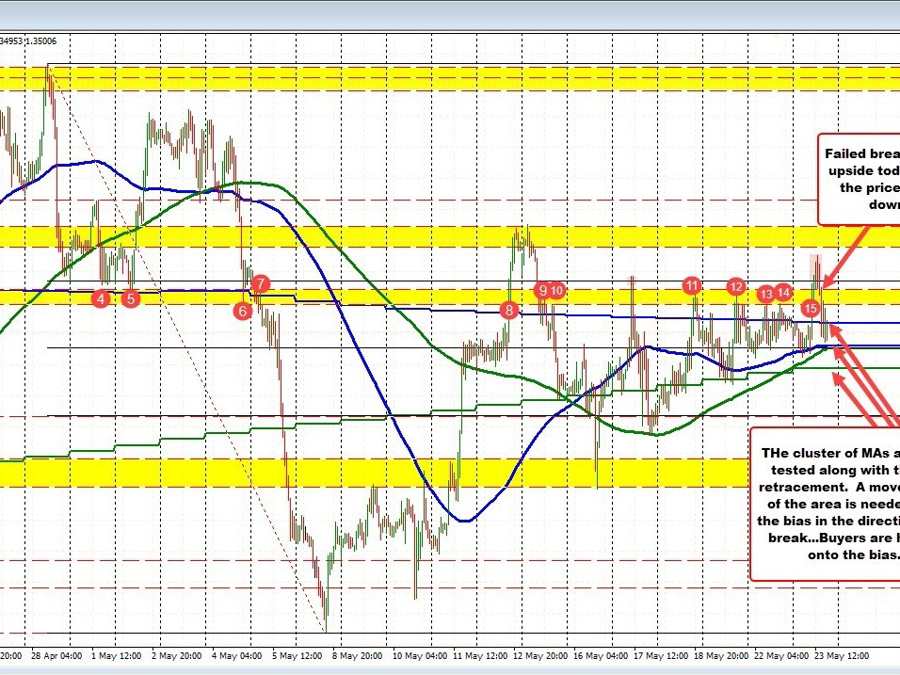
The USDCAD pair has been fluctuating and is moving back towards its daily low, inching closer to a critical confluence of support defined by several key metrics: a 100-hour moving average of 1.34918, a 50% retracement of the range since April 28 high at 1.34905, and a 200-hour moving average at 1.34902. The pair reached a low of 1.3494 in the North American trading session but found buyer support, with the current trading position at 1.3505.
On the descent, the pair fell below the 100-day moving average at 1.35058. Should the pair rebound above this moving average, it could shift the short-term buying momentum upwards. However, if the support cluster around the 1.3490 level is broken, the next key target would be the 200-day moving average at 1.34775; breaching this level would intensify the bearish bias.
Currently, the pair is characterized by choppy price action, with all key moving averages and the 50% midpoint retracement level converging within a narrow 28-pip range. Although this volatility can be frustrating, the bright side is that this convergence zone can serve as a barometer for market sentiment—bullish if above, bearish if below. Furthermore, prices usually diverge from converged moving averages over time, hinting at a potential breakout. Traders can thus anticipate a significant price movement in the near future.