The USDCAD has continued it’s run to the upside after an early move above the 200 hour MA, ultimately led to the breaking above the confined range between
1.3344 and 1.3454 (110 pips – see red box in the chart below).
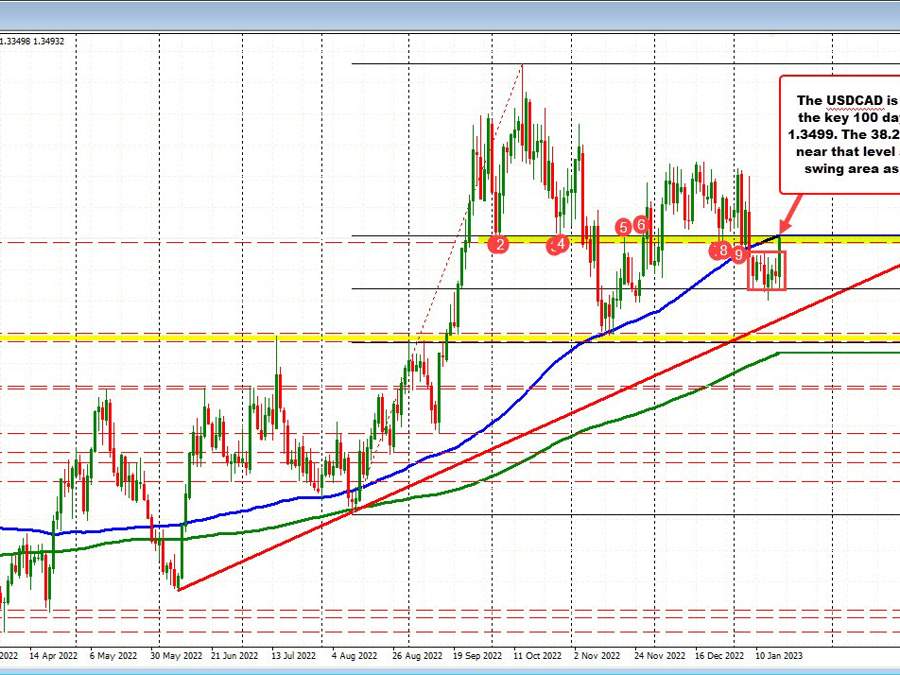
USDCAD moves up to a cluster of resistance
The momentum higher has now taken the price to a high in the current hourly bar at 1.34966. That is just short of the:
- 100 day moving average at 1.34997
- The broken 38.2% retracement of the move up from the August 11 low at 1.34995
- A swing area between 1.34809 and 1.34995, and
- The natural resistance at 1.3500
That cluster of resistance should give traders pause for cause on the first test with a stop on a break above.
Key level for both buyers and sellers. Don’ be surprised to see sellers leaning near the level.
This article was originally published by Forexlive.com. Read the original article here.