USDCAD moves back between 100/200 hour MA
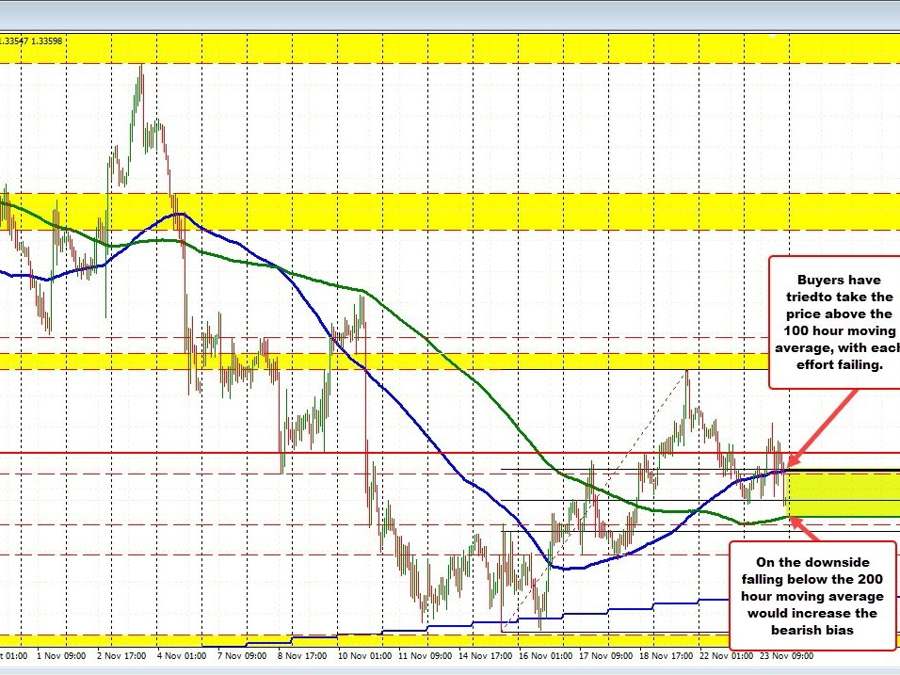
The USDCAD has seen moves up and down today. The price started the day below the 100 hour moving average (blue line in the chart above), but failed as support buyers leaned near the 50% midpoint of the range over the last few weeks.
Since that initial dip the price has traveled above and below the 100 hour moving average on a number of different occasions.
The most recent move has been to the downside, which has taken the price to a new session low for the day and also just below the 50% midpoint at 1.33598. The low price just reached 1.33539. Sellers are making a play.
What next?
On the downside, the 200 hour moving average comes in at 1.33427. On the topside the 100 hour moving average and 38.2% retracement comes in at 1.33916. Getting outside those ranges and staying outside those ranges will be the next clue that traders will be looking for to determine the next shove – higher or lower.
The move back to the downside comes despite a sharp move down in the price of crude oil today. Typically when crude moves lower, the price of the USDCAD moves higher. The price did move higher, but the momentum could not continue. Buyers turned to sellers. Now those sellers are making the play for control.
Can the sellers now take more of it on a move below the lower 200 hour MA and look toward other downside targets including the 100 day MA at 1.32608?