Buyers come in against the 100 hour moving average in the North American session
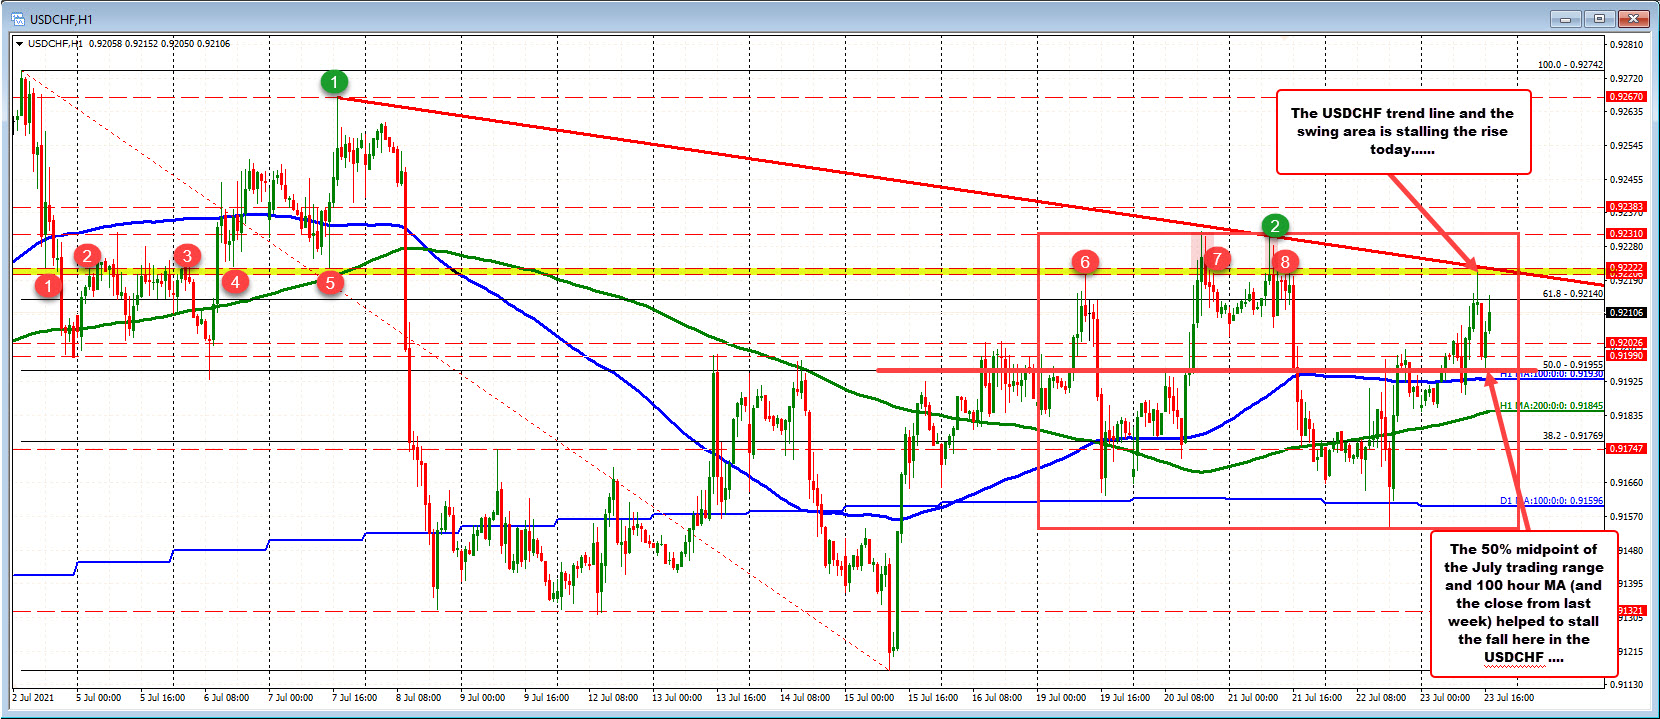
The USDCHF support/resistance levels have now been defined in what has been an up and down trading session today. The pair is higher on the day, but there has been a number of up and down swings.
The last moves first saw the price move to a new session high of 0.9221. That the price took the price to a swing area between 0.92208 and 0.9222, and also just below a downward sloping trendline at 0.92228. Sellers leaned against the resistance level and the price moved lower.
The subsequent fall off that level has seen the price move down to retest its 50% midpoint of the July trading range. That level comes in at 0.91955. Also near the level is the sideways 100 hour moving average at 0.91930 (see blue line). Buyers leaned against the support level and the price has moved higher
With support at the 100 hour moving average and 50% retracement between 0.9193 and 0.91955, and resistance at the swing area and trendline between 0.92206 and 0.92222, the battle lines have been drawn for traders.
In between those lines, where the price currently trades, is where the battle between buyers and sellers is being waged as traders await the next shove either above resistance or below the technical support.