Technical Analysis

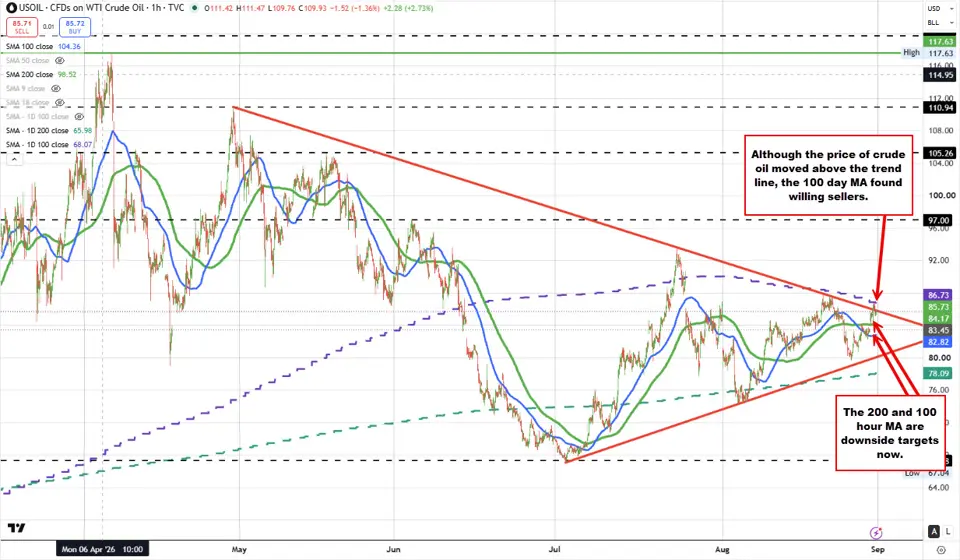
Buyers in crude oil had their shot to take price higher from a technical perspective and they missed.

Buyers in crude oil had their shot to take price higher from a technical perspective and they missed.

Crude oil futures are moving higher today, currently trading at $85.41 — up around $2 on the session. The high extended to $86.79, the best level since August 21. At session highs, the price was testing the key 100-day moving average at $86.73. Buyers briefly pushed price above that MA, but momentum faded fast and […]
Buyers in crude oil had their shot to take price higher from a technical perspective and they missed. Read More »

EUR/USD Analysis – August 28: Kevin Warsh Reaffirms the Fed’s Focus on Inflation

EUR/USD Analysis – August 28: Kevin Warsh Reaffirms the Fed’s Focus on Inflation

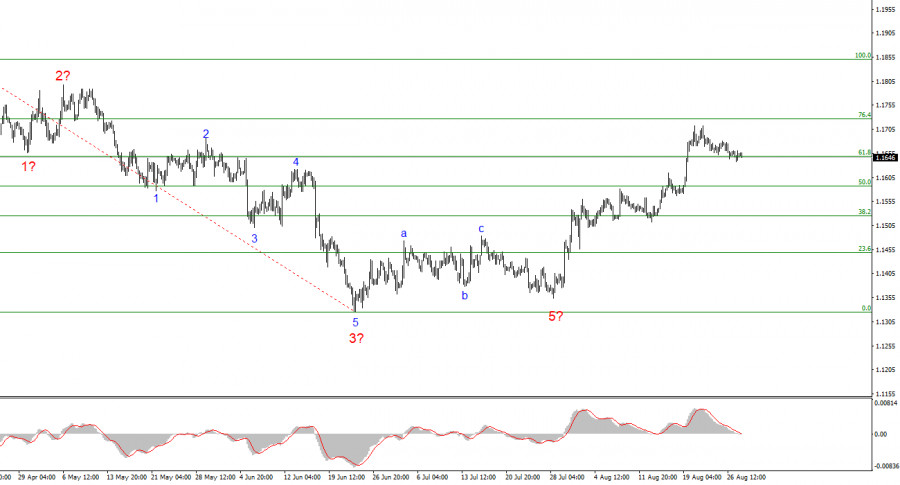
The wave count on the four-hour chart for EUR/USD is becoming more complex. There is still no question of canceling the bullish trend segment (bottom chart) that began in January last year. On the contrary, we have seen a complete A-B-C corrective structure, which is most likely finished. We never saw a convincing wave 5

EUR/USD Analysis – August 28: Kevin Warsh Reaffirms the Fed’s Focus on Inflation Read More »

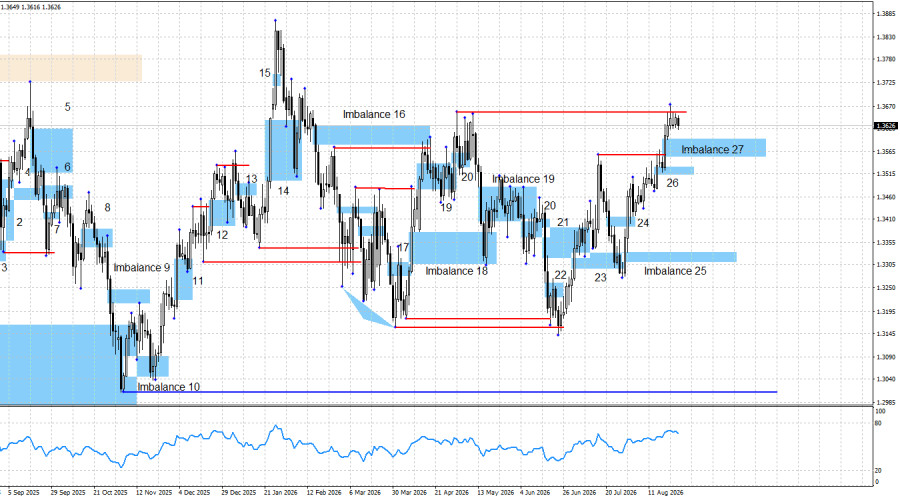
GBP/USD – Smart Money Analysis: The Pound Remains in a Narrow Range

GBP/USD – Smart Money Analysis: The Pound Remains in a Narrow Range

The GBP/USD pair continues to rise, and this move appears fully justified. As a reminder, the dollar has faced numerous negative factors in recent weeks, including the US Treasury’s decision to increase its purchases of long-term bonds, a weak Nonfarm Payrolls report, slowing consumer price inflation, slower GDP growth, and declining market expectations for tighter

GBP/USD – Smart Money Analysis: The Pound Remains in a Narrow Range Read More »

Nasdaq and S&P indices are settling between risk/bias defining MAs as the week comes to a close

Nasdaq and S&P indices are settling between risk/bias defining MAs as the week comes to a close

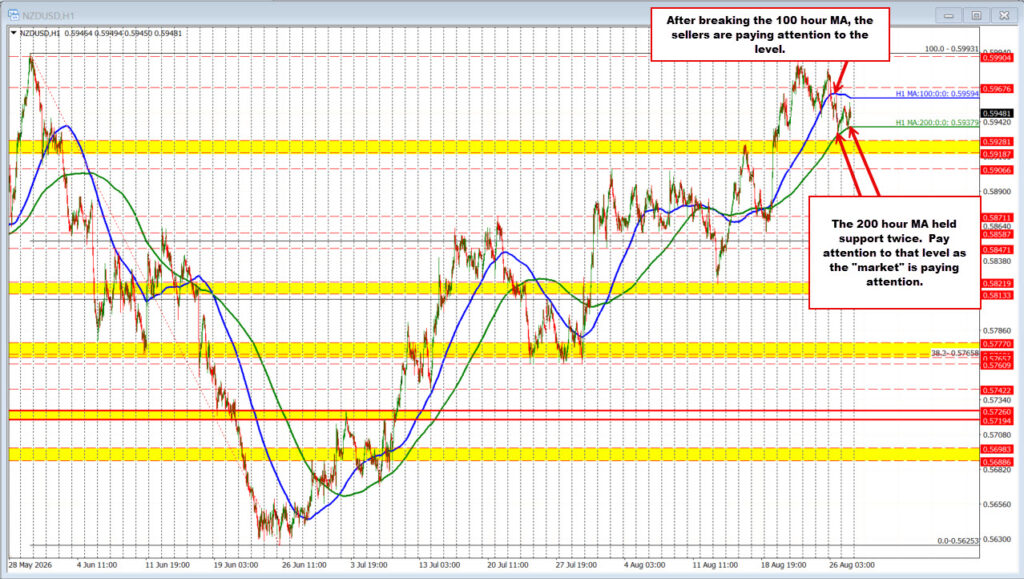
Both the Nasdaq and S&P indices are settling with nearly identical gains of around 0.45% on the day. From a technical perspective, both are also ending the week caught between key shorter-term moving averages — below their 100-hour moving averages on the topside, but above their 200-hour moving averages on the downside. That sets up

Nasdaq and S&P indices are settling between risk/bias defining MAs as the week comes to a close Read More »

This site uses cookies, read the Cookie and Privacy Policy. 64-85% of retail investors lose money when trading. Risk Disclaimer.